INITIAL EXPLORATION
As a group, we decided to use student air travel as our primary data source. In the initial stages of this brief, we felt it would be best to experiment with our own, independent approaches, unifying the through-lines as the project progressed.
While exploring the direction for my approach, I wanted to consider a method that could simultaneously function as an educational resource and a tool to improve the accuracy of the dataset itself. The aim of the application I designed was to encourage engagement with climate change awareness across the UAL student body in a comprehensive and playful way.
The app consists of three separate categories: My UAL Emissions Log, UAL Emissions and a Glossary of climate change-related terminology.
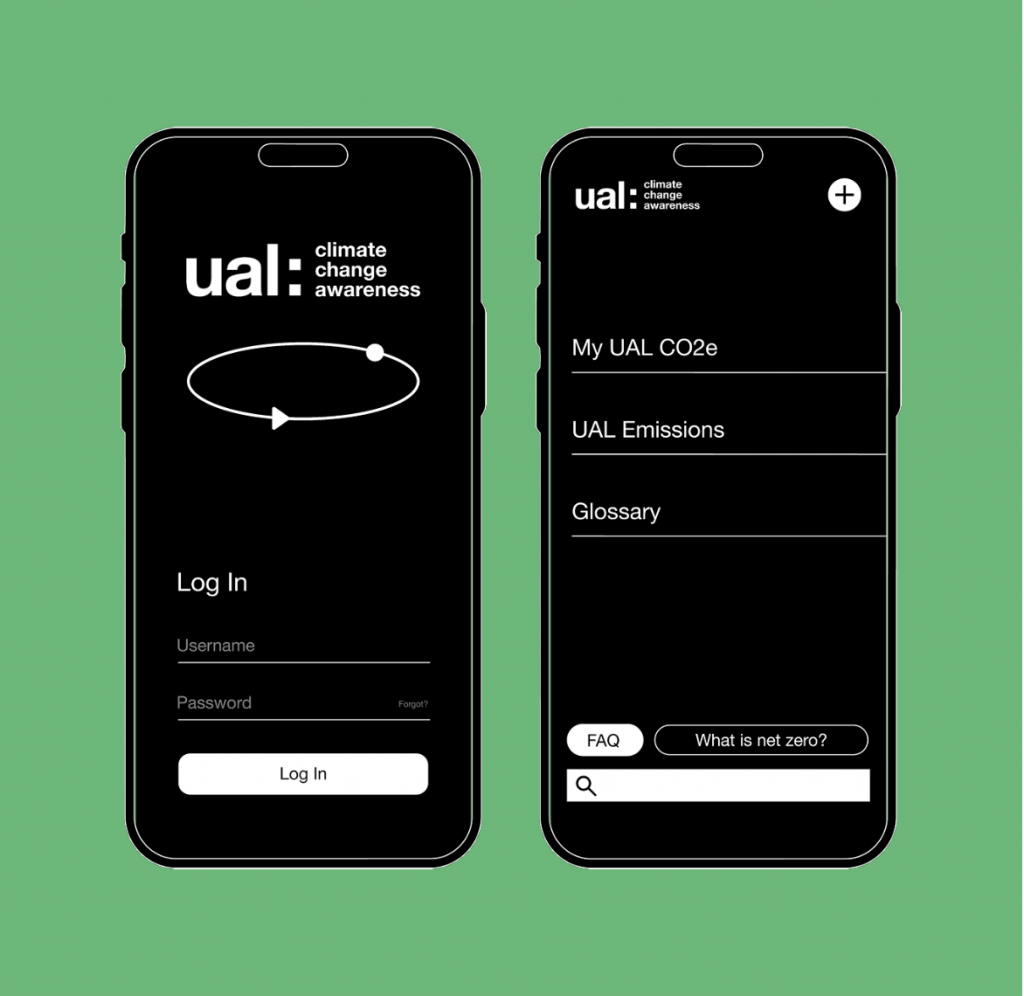
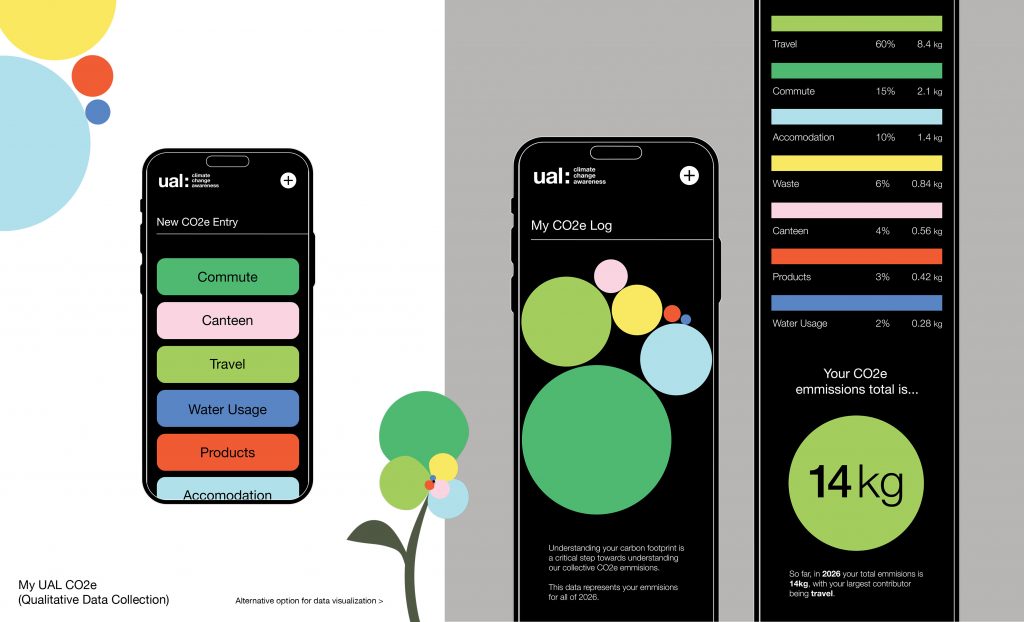
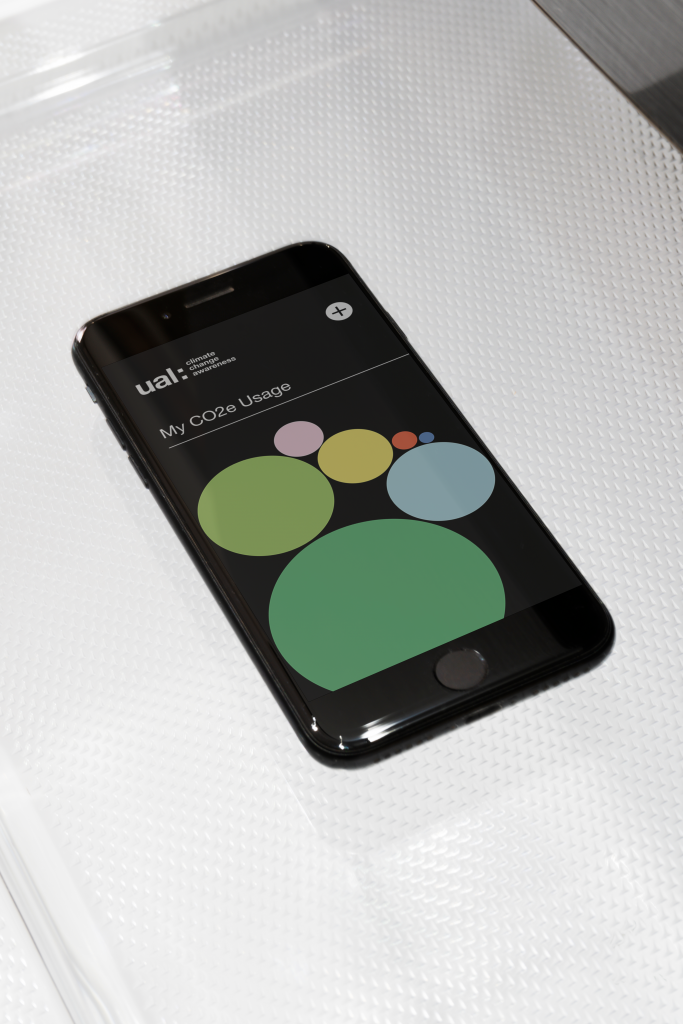
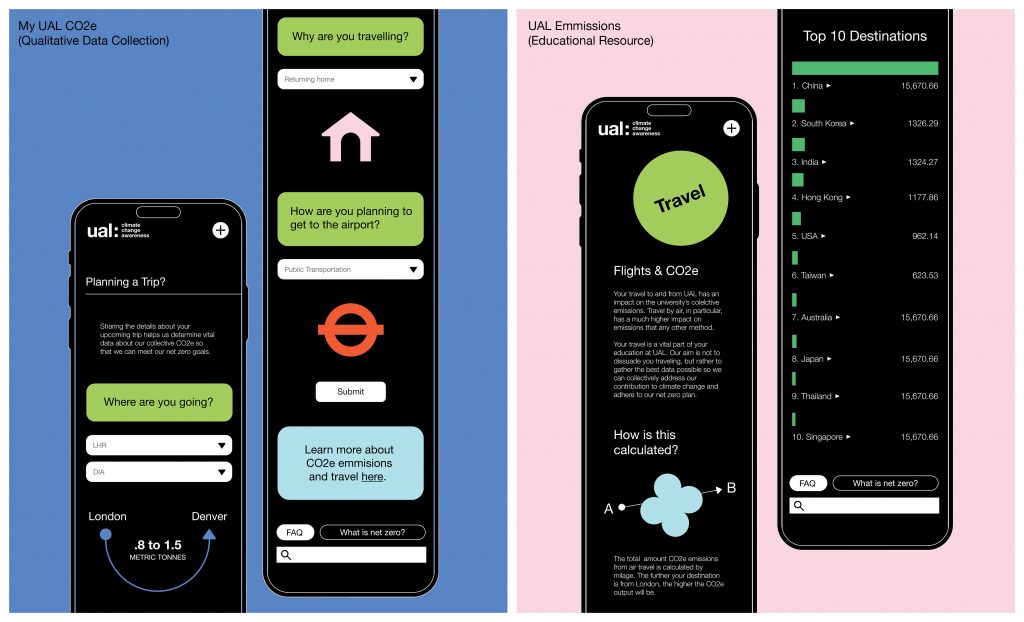
As I was designing this project, I tried to experiment with varied methods of presenting the data that would foster better comprehension. I organized the interface into modules that the user could navigate seamlessly, making the viewer an active participant in their own carbon emissions footprint and their independent educational experience.
EXPANDING OUR APPROACH
After digesting the feedback we received from our first presentation, the direction that I took felt too much like a product and likely too outcome driven. We explored the possibility of using the application as a way to gamify other ideas within our group, but ultimately we shifted towards considering individual versus systemic responsibility, as this was a recurring theme in our discussions.
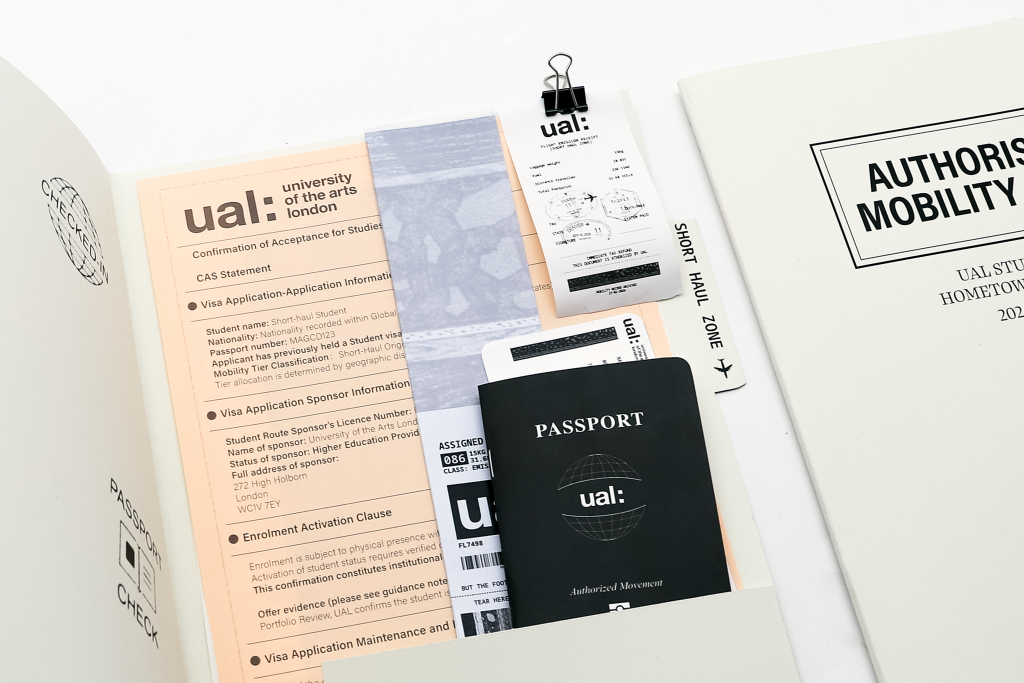
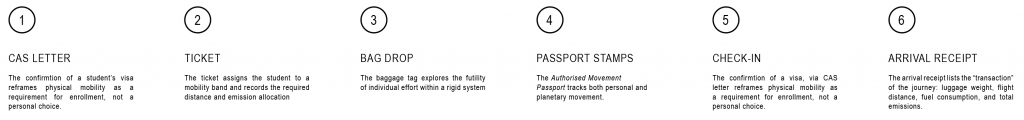
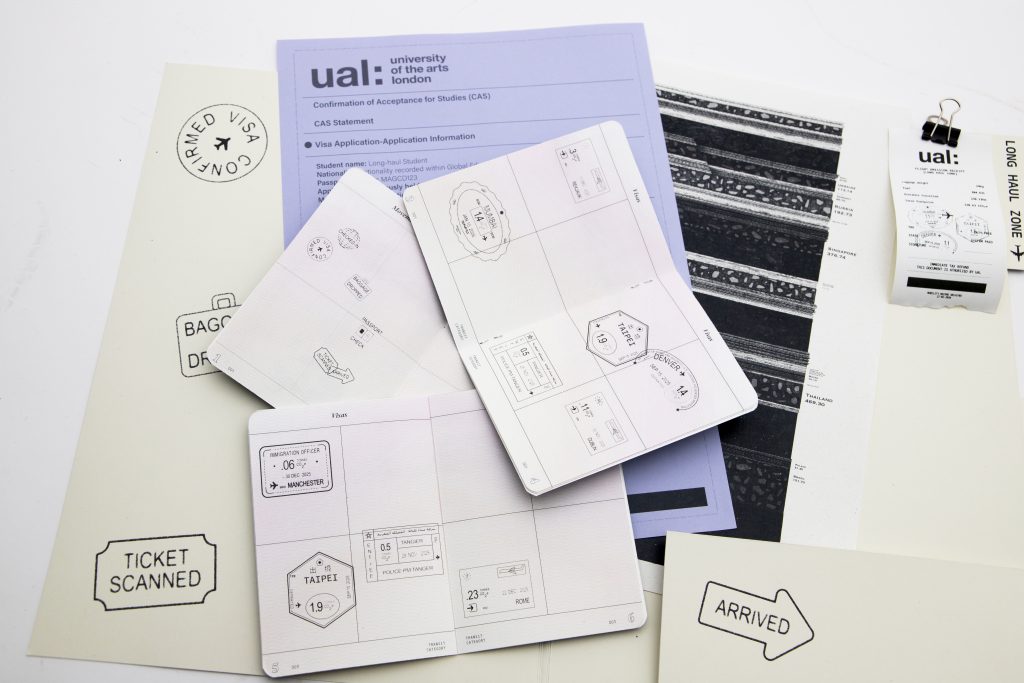
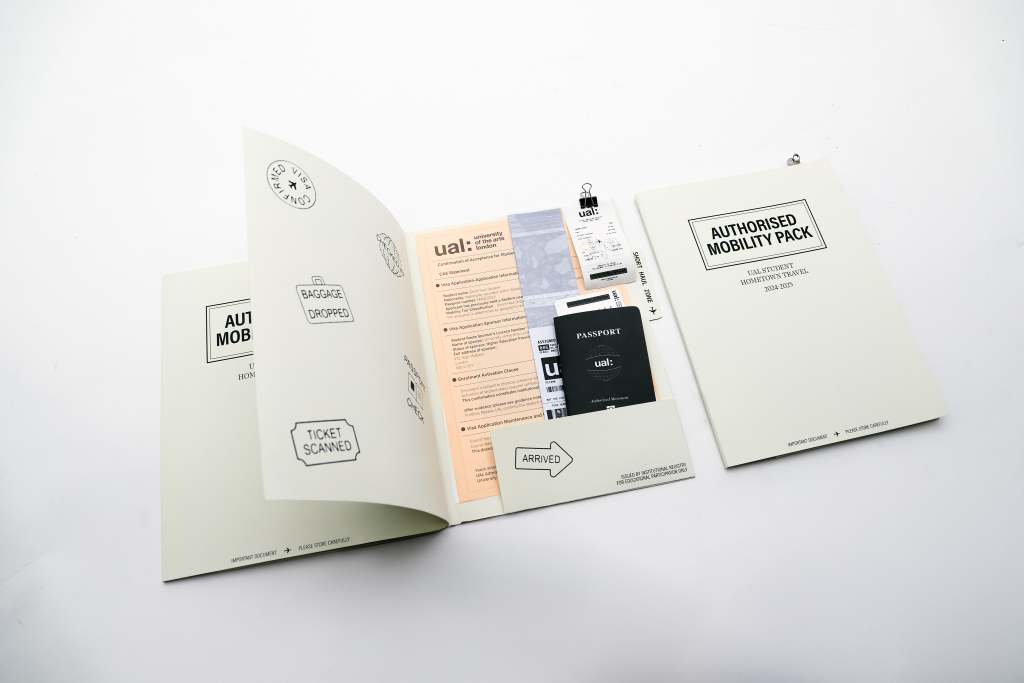
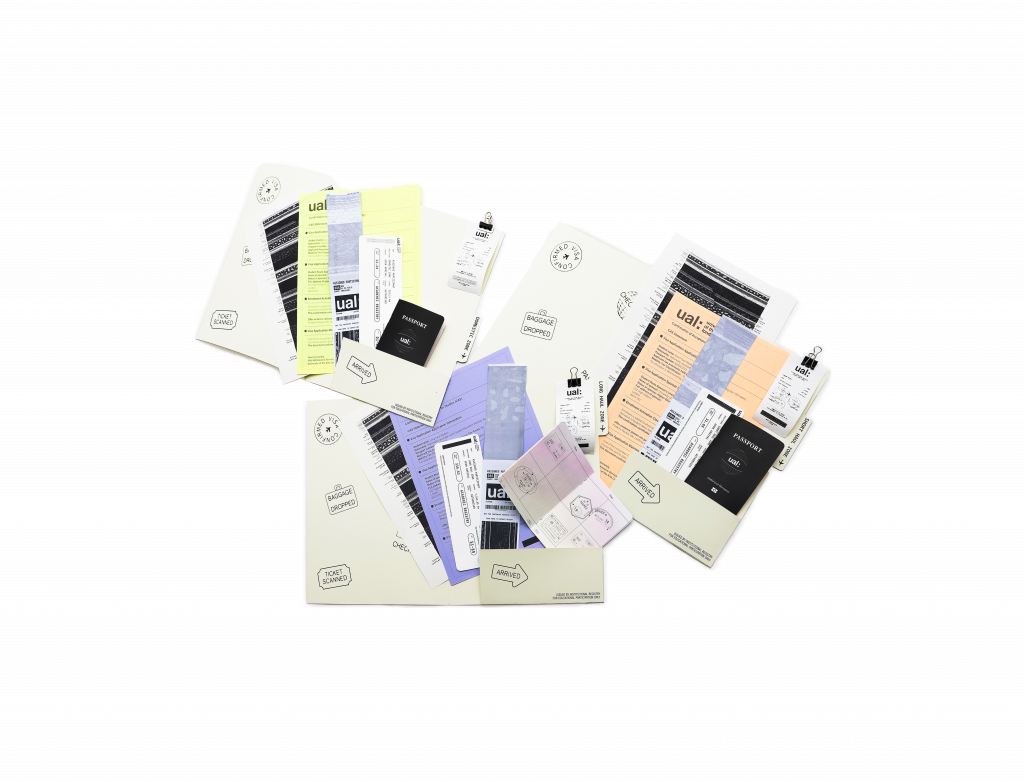
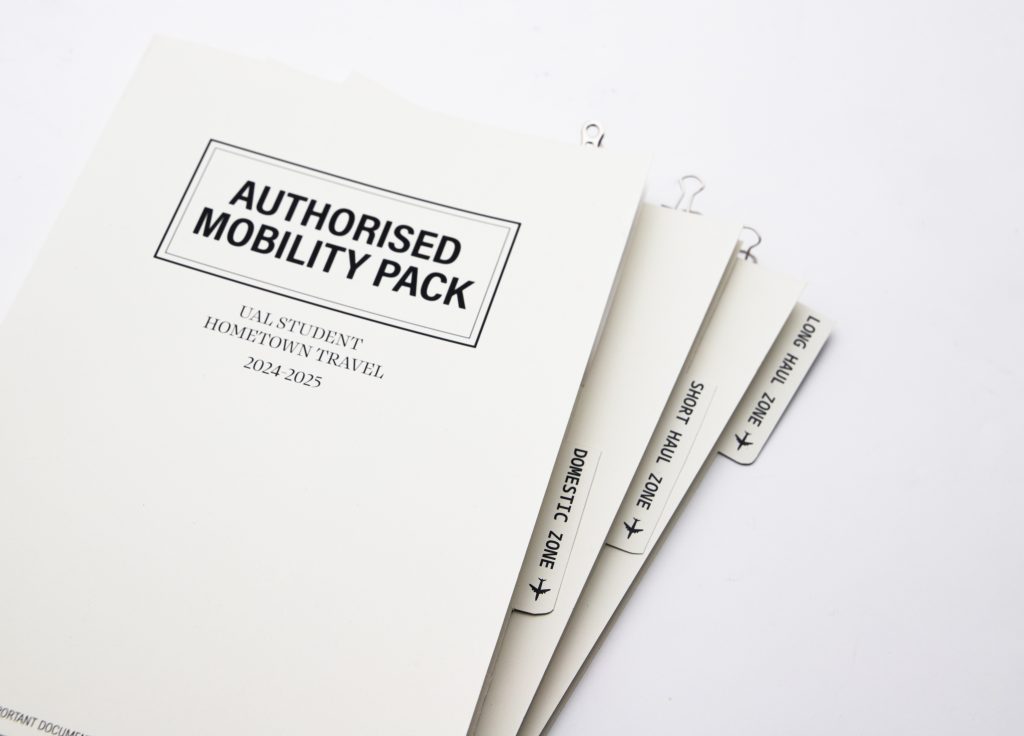
As international students, our position was unified. We wanted to examine the process of travel as movements within a system. In order to communicate this effectively, we devised a plan to develop documents that corresponded to these movements, implementing our dataset wherever possible.
As our research and experimentation started to take shape, we began to define the steps within this process and their meaning within the context of this metaphor. I designed a set of icons that illustrated these steps.

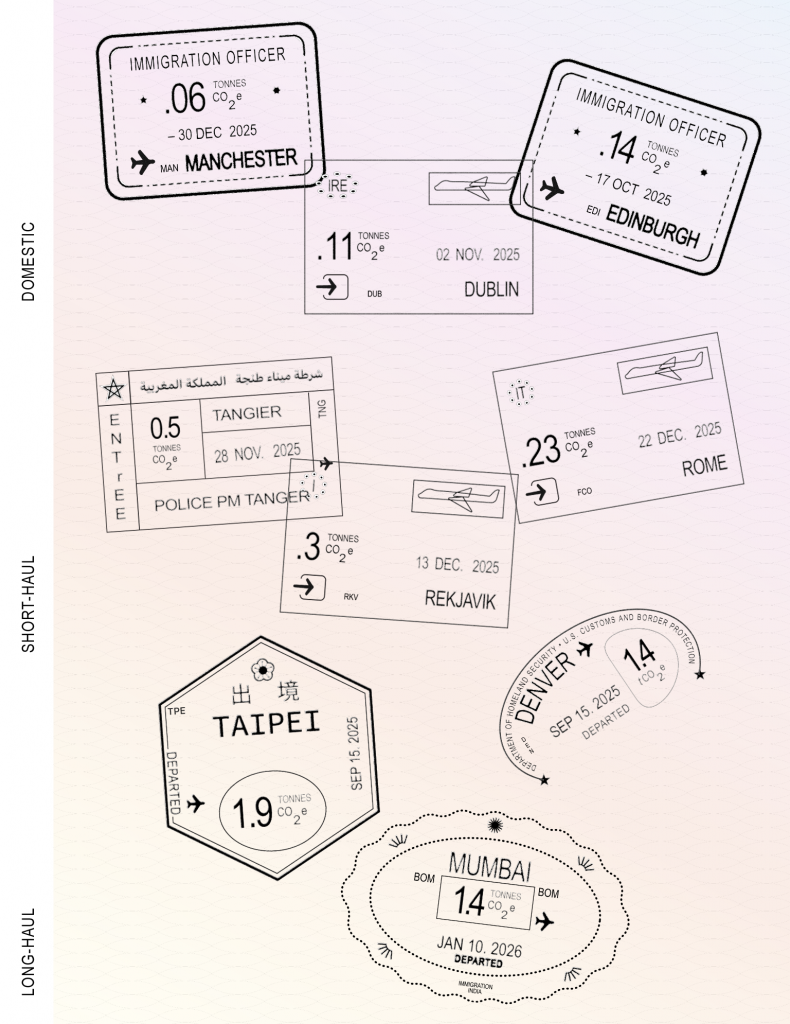
One of the main documents in our Authorized Movement Pack was a passport. I designed this document, in addition to the passport stamps. Each stamp includes the calculated emissions from our dataset.
In my written task, I’ve analyzed our approach, research, and outcomes in greater detail. This project was a wonderful exercise in navigating meaningful ways to visualise complex data using metaphor, storytelling and graphic communication design.
Leave a Reply